CloudWatch EMF in Honeycomb
The CloudWatch embedded metric format (EMF) is a convenient way to publish metrics to CloudWatch from your apps running in AWS - especially Lambda functions. You just need to emit logs in the right JSON format and CloudWatch Logs will automatically publish them to CloudWatch Metrics.
This is okay for basic use cases where you have zero or few dimensions on your metrics and those dimensions are low cardinality. If they're high cardinality, Amazon advises that you instead do not create dimensions and instead treat the metrics as logs and query them using CloudWatch Log Insights. So you have to make a trade-off between something useful, something affordable and something easy to use.
Or you could use Honeycomb! Honeycomb doesn't make you decide in advance which properties (or combination of properties) would be useful dimensions. You can instead mix and match at query-time. It's the best of both worlds (and a whole lot more, but that's another whole post).
But I don't want to rewrite my stack just to trial Honeycomb
It's tricky, isn't it? It's hard to evaluate an observability platform without using your own data, but it's also quite a commitment to get data in there.
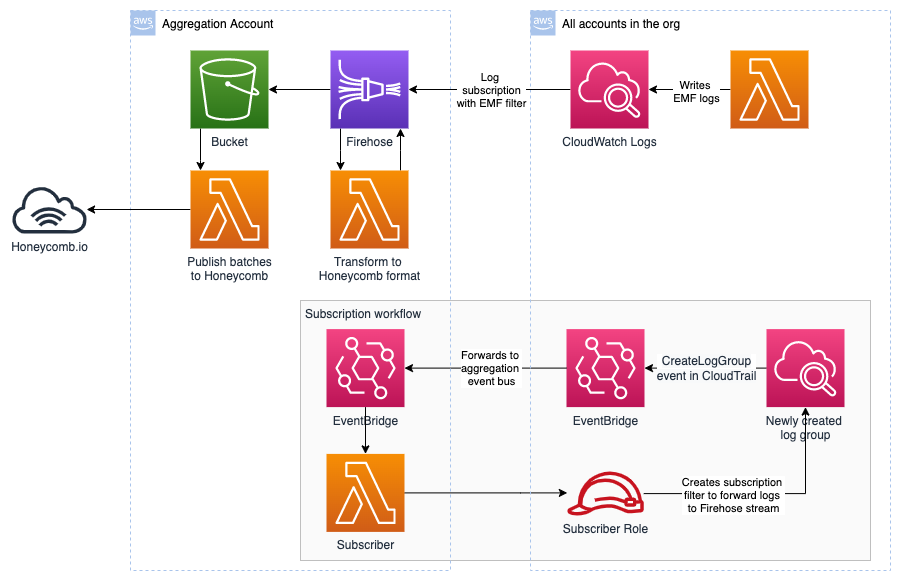
That's why I made a tool that can forward all CloudWatch EMF logs across an AWS org to Honeycomb. Once deployed, all log groups in all accounts in all regions will have EMF log entries (and only those entries) forwarded to Honeycomb. Then you can make a direct comparison and see if Honeycomb is useful to you.
Here's a diagram of how the pieces fit together:
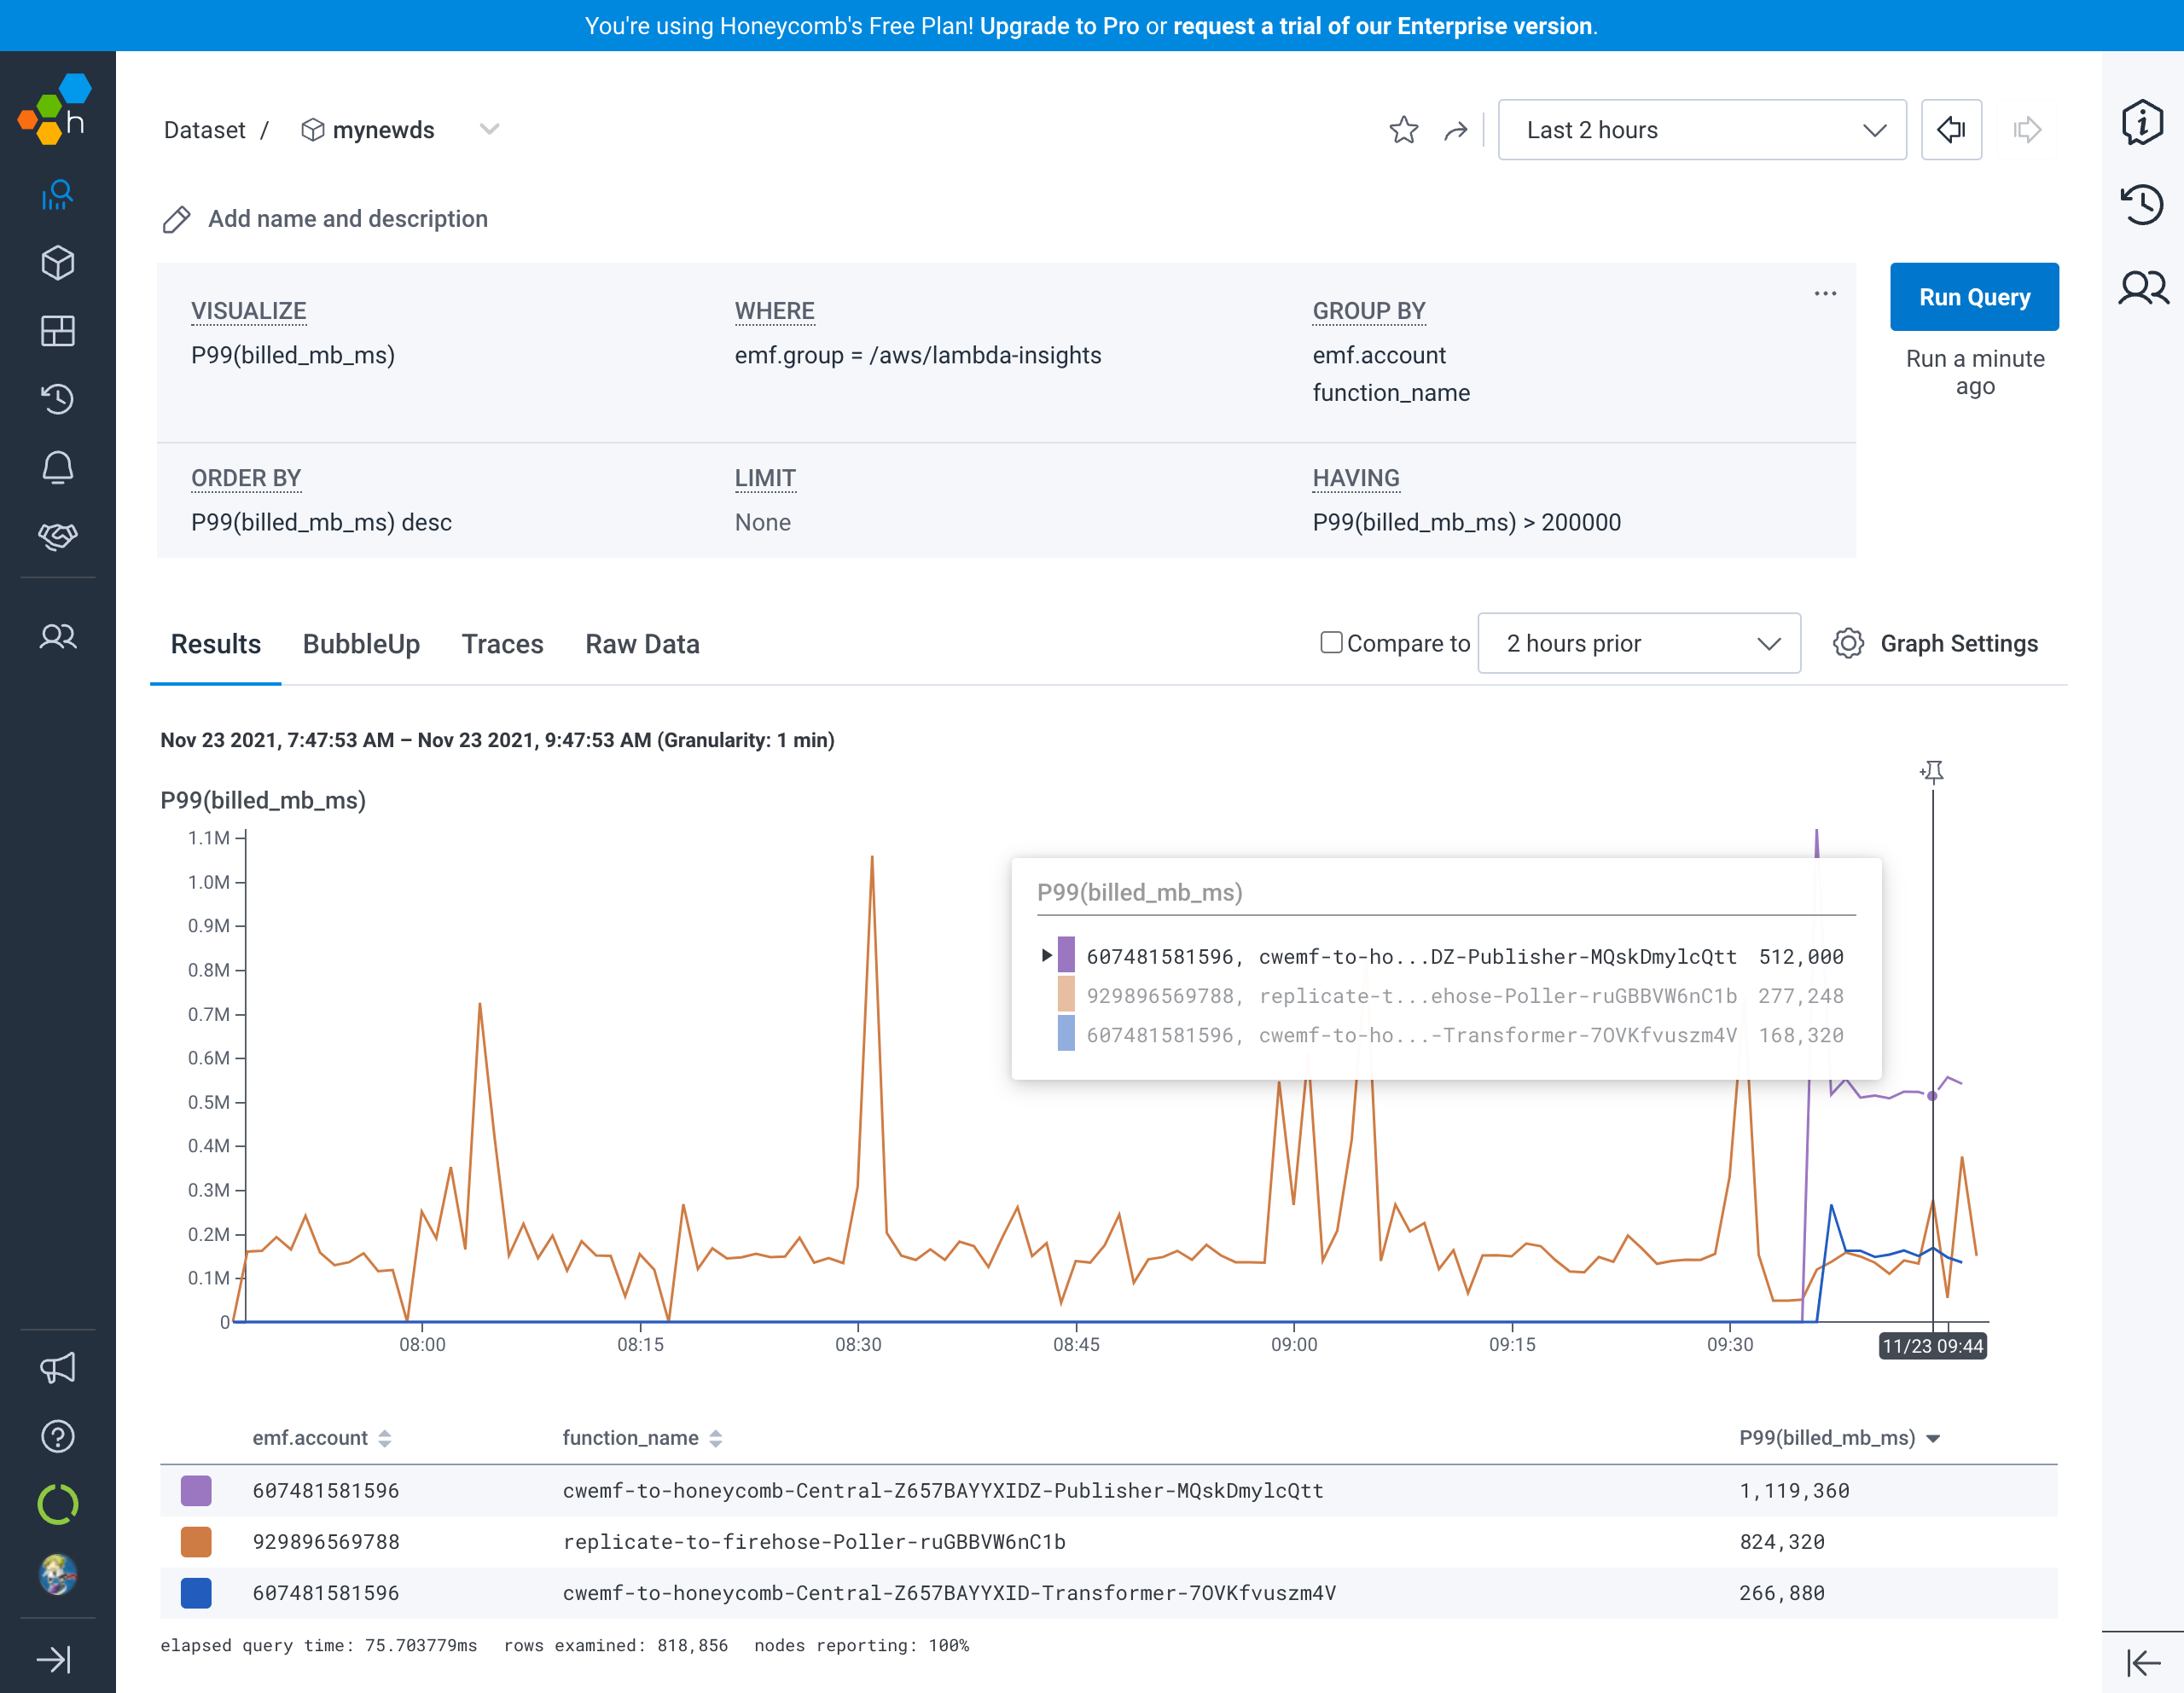
And here's a screenshot of something that took a couple seconds of clicking around in Honeycomb, but would be difficult to impossible in CloudWatch. It's all Lambda functions in my personal org that have used more than 200 MB-seconds over the last 2 hours, broken down by account ID and function name. (The Lambda Insights layer emits these metrics in EMF format.)